Contents
How this survey sample calculator works
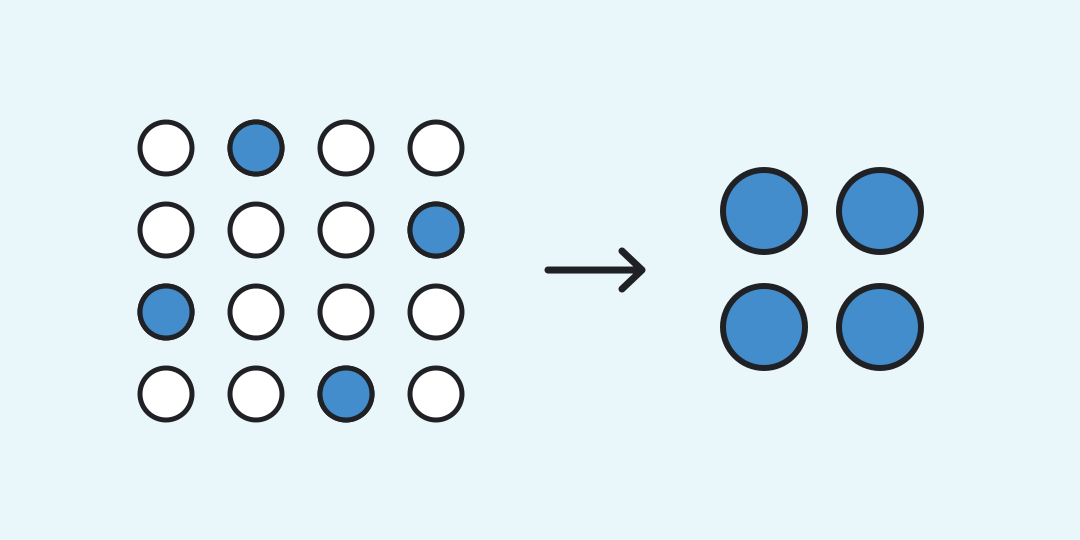
The calculator estimates how many completed survey answers you need to measure one proportion. Choose a confidence level, a margin of error in percentage points, and an expected proportion. Enter the population size only if the whole group is known.
Why the initial answer is 385
At 95% confidence, a margin of ±5 percentage points and an unknown proportion represented by 50%, the large-population calculation gives 384.15. You cannot collect part of a completed answer, so the result is rounded up to 385. The method estimates a yes/no share or one choice's share, not a mean rating.
Here z is the normal critical value, p the expected share, and e the margin expressed as a proportion: five percentage points becomes 0.05. Using 50% when the share is unknown produces the largest planned sample. OpenStax explains this choice and the formula.
For a known finite population of N people, the calculator reduces the estimate before rounding up:
Three survey plans
Open city survey. Choose 95% confidence, ±5 percentage points, expected share 50%, and leave population blank. The target is 385 completed answers. Sending 385 invitations will usually not produce 385 answers; plan invitations separately using an expected response rate.
Group of 1,000. Keep the same confidence, margin and expected share, but enter 1,000 as the population. The target falls to 278 completed answers, or 27.8% of the group. The reduction reflects sampling without replacement from a bounded group.
Prior estimate of 20%. For a large group with 95% confidence and ±5 points, enter 20% as the expected share. The result is 246 answers. If the actual share is closer to 50%, that smaller plan may miss the intended precision.
What the count does not guarantee
The formula assumes a simple random sample and concerns sampling uncertainty. A voluntary poll of friends or followers can stay biased even with many answers. Cluster designs, weighting and nonresponse can require a larger target. Statistics Canada separates population, design and response adjustments.
Margin of error is in percentage points: ±5 around a measured 40% means roughly 35% to 45%, not five percent of 40. The output counts usable answers to the question, not people contacted. It does not size a two-arm experiment or a study of average values.
Common planning questions
Decide whom the result should describe before choosing the numbers in the form.
Why does the form start at 50%?
Without a good prior estimate, 50% gives the largest required sample for the selected confidence and margin. It is a cautious planning value, not a prediction.
Can I leave population size empty?
Yes. The calculator then uses the large-population formula. Enter a size only for a defined, bounded group.
Why is the result rounded up?
A fraction of a completed response cannot be collected. Rounding down would fall short of the calculated target.
Do 385 invitations count as 385 responses?
No. The result is completed, usable answers. Divide it by an expected response rate to plan invitations.
Will more voluntary answers remove selection bias?
No. More answers can reduce random variation, but cannot make a self-selected group representative by themselves.
Similar calculators
You may find the following calculators on the same topic useful:
- Simple Calculator. Simply calculate whatever you need.
- Pi Calculator. Find out the value of Pi with the desired number of decimal places.
- Calculator for the Number 'e'. Calculate the desired number of decimal places in the number 'e' (Euler's number or Napier's constant) using the 'e' number calculator.
- Quadratic Equations Calculator. Apply methods to solve quadratic equations using formulas, discriminant, and Vieta's theorem.
- Percentage Less Calculator. Calculate online how much one number is less than another in percentage.
- Percentage More Calculator. Calculate online how much one number is more than another in percentage.
- Scientific Calculator. Solve complex equations with our sophisticated (scientific, engineering, financial) calculator.
- Toss a Coin Online. With this tool, you can toss a coin online as many times as you wish.
- Roots Calculator. Determine precise values of roots of various degrees, including square and cubic.
- Fraction Calculator. Calculate the addition, multiplication, and reduction of regular fractions.
Share on social media
If you liked it, please share the calculator on your social media platforms. It`s easy for you and beneficial for the project`s promotion. Thank you!