Contents
How this calculator compares spread with the mean
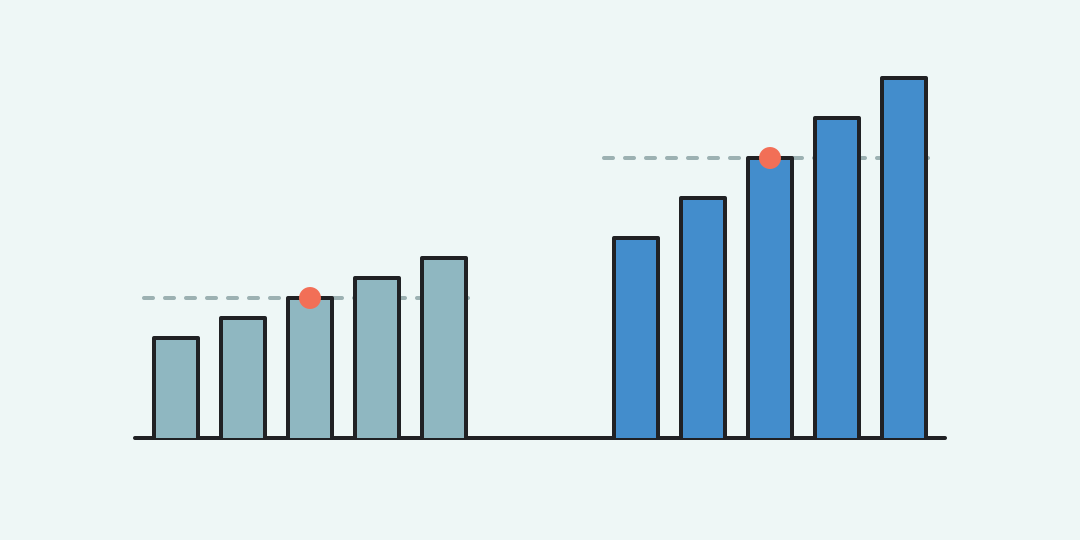
Enter at least two numbers and choose whether they describe a whole population or a sample. The calculator divides their standard deviation by their mean and shows the coefficient of variation (CV) as a percentage.
The denominator matters twice
First, the chosen data type determines the standard deviation: a population uses all N observations, while a sample uses n − 1 in its variance. The resulting deviation is then divided by the arithmetic mean.
The units cancel. A CV of 20% describes the overall spread relative to the mean; it does not say that every observation lies exactly 20% away. The details show the mean, deviation, unsigned RSD and unscaled ratio.
Before treating a difference between two CV values as important, check that both series measure the same kind of quantity and were collected in comparable ways. A dimensionless number alone cannot settle that question.
Checks with real numbers
For the complete set 10, 12, 14, 16, 18, the mean is 14 and the population standard deviation is about 2.828. The result is about 20.203%. This is useful when comparing this set with another set on a different scale.
Treat the same five values as a sample and the deviation becomes about 3.162. The CV rises to about 22.588%; the values and mean did not change, only the variance divisor did.
For -55, -50 and -45 in population mode, the mean is -50 and the deviation is about 4.082. Signed CV is about -8.165%, while unsigned RSD is 8.165%. A negative answer reflects the denominator, not a negative amount of variation.
When a percentage can mislead
A zero mean makes CV undefined: -1, 0 and 1 cannot produce a finite percentage. A mean close to zero can make CV very large and unstable; the calculator warns when its magnitude falls below the deviation. CV is most interpretable for measurements with a meaningful zero. Shifting every value by a constant changes the mean and therefore changes CV.
Use spaces, new lines or semicolons between values. A decimal comma without a following space is part of a number, whereas a comma followed by a space separates numbers. The rounding control changes the display, not the underlying calculation or copied value. For absolute rather than relative spread, use the standard deviation calculator.
Questions before comparing datasets
These distinctions prevent a percentage from acquiring a meaning the data do not support.
Can CV exceed 100%?
Yes. If standard deviation exceeds the magnitude of a positive mean, CV exceeds 100%. That is a valid calculation, though the mean may be a poor reference point.
Does a smaller CV always mean a better process?
No. It means less relative spread under this definition. Whether that is desirable depends on what the measurements represent.
Can I compare metres with centimetres?
Yes, if both series measure comparable quantities and differ only by a positive unit multiplier. CV does not change under such rescaling.
Why does a negative mean produce a negative CV?
This calculator preserves the sign of the mean in the denominator. RSD in the details uses the magnitude when an unsigned comparison is useful.
What if all values are equal?
The standard deviation is zero, so CV and RSD are both zero as long as their common mean is not zero. All-zero data have an undefined CV.
Similar calculators
You may find the following calculators on the same topic useful:
- Variance calculator. Paste numbers, choose a data type, and see how far the values spread around their mean.
- Percentile and percentile rank calculator. Enter numbers, then choose a percentile or compare one value with the list.
- Bayes theorem calculator. Use the event rate, signal sensitivity and false-alarm rate to update the probability after a signal.
- Sample size calculator. Choose your precision and confidence level to estimate how many usable answers to collect.
- Simple Calculator. Simply calculate whatever you need.
- Pi Calculator. Find out the value of Pi with the desired number of decimal places.
- Calculator for the Number 'e'. Calculate the desired number of decimal places in the number 'e' (Euler's number or Napier's constant) using the 'e' number calculator.
- Quadratic Equations Calculator. Apply methods to solve quadratic equations using formulas, discriminant, and Vieta's theorem.
- Percentage Less Calculator. Calculate online how much one number is less than another in percentage.
- Percentage More Calculator. Calculate online how much one number is more than another in percentage.
Share on social media
If you liked it, please share the calculator on your social media platforms. It`s easy for you and beneficial for the project`s promotion. Thank you!