Contents
What the standard deviation calculator measures
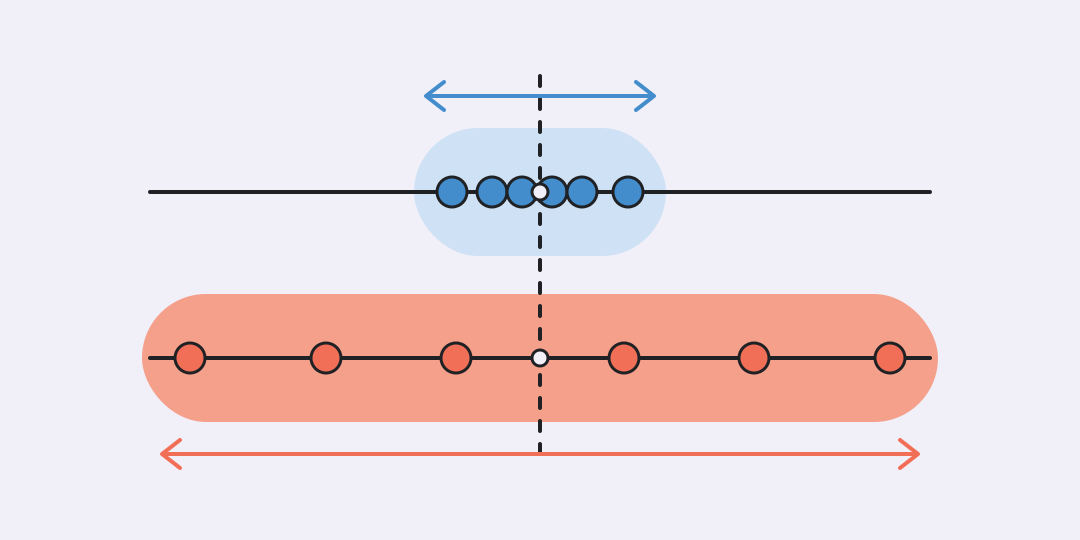
Enter a list of numbers and choose whether it is a complete population or a sample. The calculator returns the standard deviation as the main result, then shows the mean, divisor, variance, count, minimum and maximum.
Choose the denominator before calculating
Standard deviation describes the scale of the spread around the arithmetic mean. For a complete population, every listed value belongs to the group being described, so the sum of squared deviations is divided by .
Here, is one value, is the population mean and is the number of values. If the list is a sample drawn from a larger population, the calculator uses the sample mean and divides by .
The correction makes the sample variance an unbiased estimator of population variance. The square root is useful as a sample standard deviation, but it is not itself a strictly unbiased estimator. Both modes require at least two values.
Standard deviation is never negative and keeps the unit of the original data. If the list is measured in seconds, the standard deviation is in seconds while the variance is in square seconds.
Worked calculations make the divisor visible
Complete population: 2, 4, 4, 4, 5, 5, 7, 9. The eight values have mean 5. Their squared deviations add to 32.
The population standard deviation is 2. In the same unit as the data, that is the characteristic scale of the spread around 5.
The same eight values treated as a sample. The mean and squared-deviation sum stay at 5 and 32, but the divisor changes from 8 to 7.
The sample standard deviation is about 2.138, slightly larger than the population result because the calculation uses .
Three close measurements: 99, 100 and 101. In population mode, the mean is 100 and the deviations are -1, 0 and 1.
The result is about 0.816 in the measurement unit. It is small relative to the mean here because all three observations sit within one unit of 100.
Input, rounding and reliable interpretation
Values may be separated by whitespace, new lines, semicolons or vertical bars. A comma followed by a space also separates values. Decimal points and decimal commas are accepted, as are scientific notation and the Unicode minus sign. This makes 1,5 one decimal value but 1, 5 two values.
Thousands grouping is not supported. Write one thousand as 1000, not 1,000 or 1 000, because those forms can be read as a decimal or as separate observations. The order of valid observations does not change the mathematical answer.
A calculation accepts at most 10,000 values and 200,000 characters, and every parsed value must be finite. The implementation recentres and rescales extreme data to reduce avoidable floating-point loss, but it rejects underflow and magnitudes that JavaScript cannot handle reliably.
The rounding control changes only the display and accepts 0 to 10 decimal places. Internal calculations and the copied result keep full machine precision. Do not round the source observations early if the result will feed another calculation.
There is no universal boundary between a small and a large standard deviation. Judge it against the data unit, scale and purpose. One outlier can increase the result sharply; adding the same constant to every value leaves it unchanged, while multiplying every value by multiplies it by . Normality is not required to calculate standard deviation.
If the next question is where one observation lies relative to its group, the Z-score calculator expresses that position in standard deviations.
Questions that affect the calculation
The formula cannot decide whether your list is the whole group or only a sample, and the numerical result cannot decide whether the spread is acceptable. These answers clarify those choices and the most common input traps.
Should I choose population or sample?
Choose population when the list contains every item in the group you want to describe. Choose sample when the observations represent a larger population and you want the n minus 1 correction.
Can standard deviation be negative?
No. Squared deviations are nonnegative and the final square root is nonnegative. A displayed negative result would indicate an error.
When is standard deviation exactly zero?
It is zero only when every entered value is equal. Then each value equals the mean and every squared deviation is zero.
Can I mix decimal commas with comma-separated values?
Use a comma without a following space as the decimal mark, such as 1,5. To separate values with commas, include a space after each comma, or use new lines or semicolons instead.
Does the list need to follow a normal distribution?
No. Standard deviation can be calculated for any finite numerical list. A normality assumption matters only for later probability claims that use a normal model.
Why can two lists with the same mean have different deviations?
The mean locates the centre, while standard deviation measures spread around it. Values 99, 100 and 101 and values 0, 100 and 200 both average 100, but the second list is far more dispersed.
Similar calculators
You may find the following calculators on the same topic useful:
- Mean, median and mode calculator. Paste a list of numbers to compare its mean, median, mode, range and endpoints.
- Quartile and interquartile range calculator. Paste a number list to measure its central half and identify observations beyond the inner fences.
- Time converter. Enter a duration and convert it instantly between common short, everyday, and average calendar units.
- Geometric mean calculator. Enter positive values to find their representative multiplicative factor.
- Harmonic mean calculator. Enter positive rates or ratios to see their harmonic mean.
- Arrangements and permutations calculator. Choose how many distinct elements to arrange and get every digit of the answer.
- Improper fraction to mixed number calculator. Enter an integer numerator and positive denominator to see the whole units and simplified remainder.
- Fraction comparison calculator. Enter two integer numerators and positive denominators to compare their values.
- Prime factorization calculator. Enter a nonzero whole number to see its prime factors and their exponents.
- Expected value calculator. Enter each possible outcome and its percentage probability to find the long-run average and spread.
Share on social media
If you liked it, please share the calculator on your social media platforms. It`s easy for you and beneficial for the project`s promotion. Thank you!