Contents
How this calculator divides an ordered data set
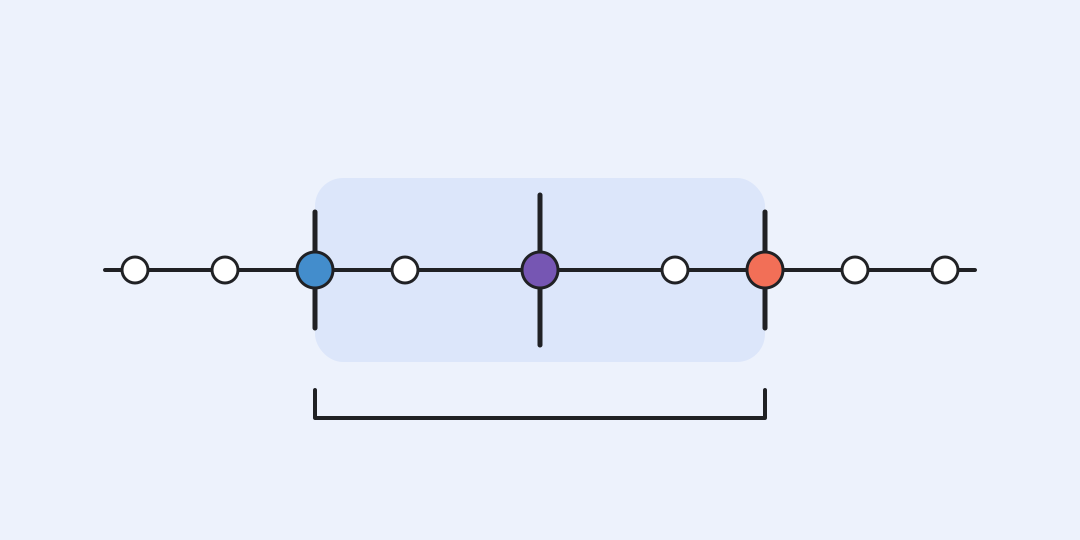
Enter a numerical list to find the first quartile Q1, median Q2, third quartile Q3 and interquartile range. The calculator sorts the values, splits them around the median and also checks the 1.5 IQR fences for possible outliers.
The median-of-halves method
After sorting, Q2 marks the centre of the full list. Q1 is the median of the lower half and Q3 is the median of the upper half. When the list has an odd count, its overall median belongs to neither half.
The interquartile range measures the width of the central half of the ordered data.
The inner fences are and . A value must lie strictly beyond a fence to be flagged. This screening rule is described in the NIST handbook.
Three lists, three useful readings
Eight consecutive values. For 1, 2, 3, 4, 5, 6, 7, 8, the quartiles are 2.5, 4.5 and 6.5. IQR is 4, the fences are −3.5 and 12.5, and no value is flagged.
An odd-sized list. For 1, 2, 3, 4, 5, Q2 is 3 and is excluded before the halves are measured. Q1 is 1.5, Q3 is 4.5 and IQR is 3.
A distant observation. For 1, 2, 2, 3, 4, 5, 6, 100, Q1 is 2 and Q3 is 5.5. The upper fence is 10.75, so 100 appears as a possible outlier worth checking.
Interpret the flag before changing the data
A possible outlier can be a typo, a changed unit or a rare but genuine event. The calculation does not decide which. Check the source and context before deleting an observation.
Quartile conventions differ between books and software. This page uses medians of halves and excludes the overall median for odd lists; spreadsheet interpolation can return different Q1 and Q3 values for the same short list. NIST compares percentile conventions.
Use one unit throughout the list. Spaces, new lines, semicolons and vertical bars separate values. Decimal points, decimal commas and scientific notation are accepted. The limit is 10,000 values or 200,000 characters.
Questions about quartiles and IQR
The method matters most for short lists. These answers clarify the choices made by this calculator.
Why do my spreadsheet and this calculator disagree?
They may use different sample-quartile conventions. This calculator takes medians of the lower and upper halves; many spreadsheets interpolate positions instead.
Is a value on a fence an outlier?
No. Only a value strictly below the lower fence or above the upper fence is flagged.
Are repeated values removed?
No. Each occurrence remains an observation and keeps its own place in the ordered list.
How many numbers are required?
At least two. The calculation is defined for a tiny list, but a small data set gives little evidence for practical conclusions.
Should I delete every flagged value?
No. First check whether it is a data error or a genuine observation. Keep or remove it according to a stated data-cleaning rule.
Can I use negative and decimal values?
Yes. Keep every observation in the same unit and separate neighbouring values unambiguously.
Similar calculators
You may find the following calculators on the same topic useful:
- Time converter. Enter a duration and convert it instantly between common short, everyday, and average calendar units.
- Geometric mean calculator. Enter positive values to find their representative multiplicative factor.
- Harmonic mean calculator. Enter positive rates or ratios to see their harmonic mean.
- Arrangements and permutations calculator. Choose how many distinct elements to arrange and get every digit of the answer.
- Improper fraction to mixed number calculator. Enter an integer numerator and positive denominator to see the whole units and simplified remainder.
- Fraction comparison calculator. Enter two integer numerators and positive denominators to compare their values.
- Prime factorization calculator. Enter a nonzero whole number to see its prime factors and their exponents.
- Expected value calculator. Enter each possible outcome and its percentage probability to find the long-run average and spread.
- Time duration calculator. Enter a start and end time to find the net duration, then add more intervals when the time is split.
- Fraction addition calculator. Enter two fractions, choose an operation and get an exact reduced answer.
Share on social media
If you liked it, please share the calculator on your social media platforms. It`s easy for you and beneficial for the project`s promotion. Thank you!